If you’re working with Linux/MacOS terminal you’ve probably used the top command to monitor processes and system resource usage.
While top and its improved htop are great for process
management, IMHO they lack the convenient dashboard-like view.
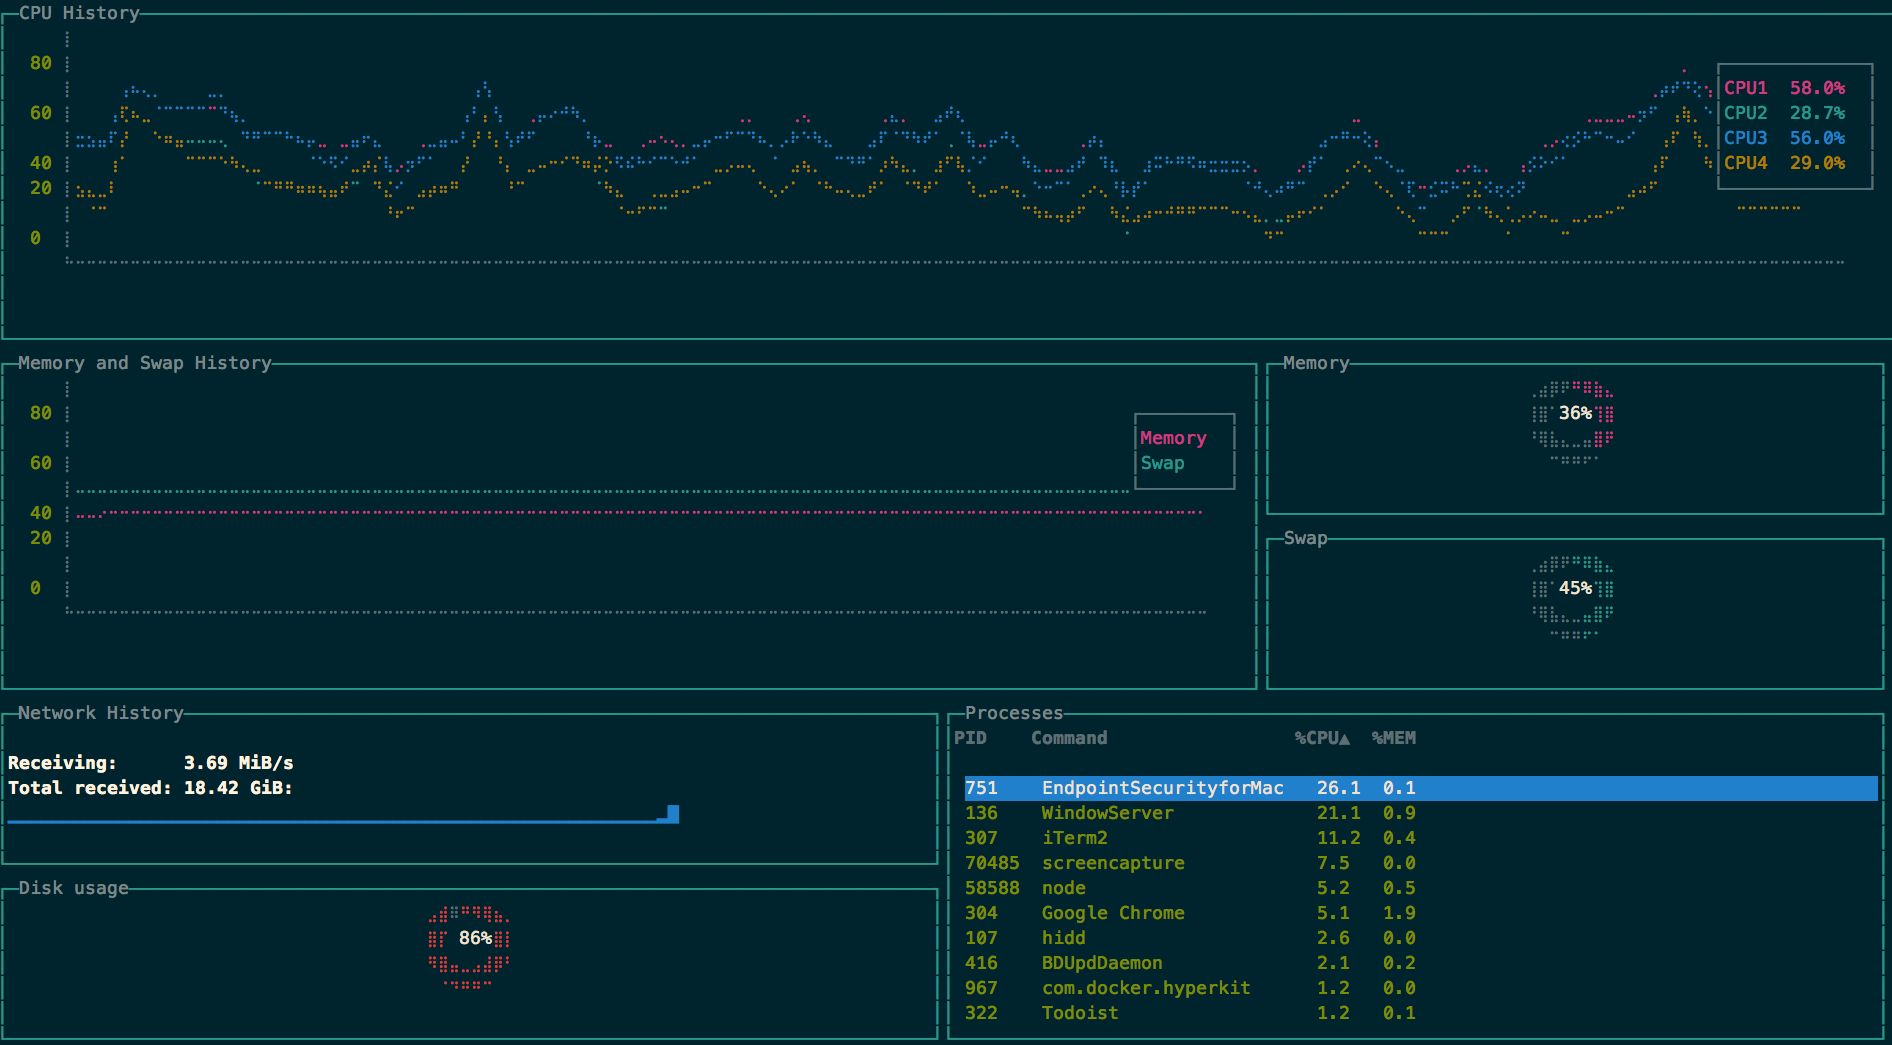
Today I learned about gtop fancy system monitoring dashboard for terminal.
Installation
$ npm install gtop -gUsage
Start the process with
$ gtopUse the following keys to sort the process table:
p: Process Idc: CPU usagem: Memory usage
Disclaimers
-
gtopdoesn’t have a built-in kill process option, though there is a feature request for it. -
For the above reason and others, I’d still use
toporhtopfor server monitoring, if you don’t have any advanced monitoring solution.