We all use good-ole console.log() to debug our JS code (see my previous TIL). Sometimes it’s just not enough. In those debug-hell situations, I call a debugger for the rescue.
Now before you say something like “I have a great debugger in my webstorm”, let me just say it’s perfectly fine. But for those complicated remote scenarios or when you’re not debugging using your working env, the following can become useful.
Coming from Python I always had pdb to watch my back. Well, that didn’t work out for me with Nodejs built-in debugger. Call me lazy, but typing repl to play with my code then stepping back out, while most times killing the service, isn’t my cup of tea.
I was excited to stumble upon the great node-inspector, which allowed me to debug in my browser.
Today I learned that as of version 6.3, Node.js comes with a built-in DevTools-based debugger which deprecates node-inspector!
The next few lines will give you the HOW-TO gist.
Usage
-
Run you Node service with the
--inspectflag. Don’t forget to use nodemon$ nodemon --inspect awesome-service.js -
Open
chrome://inspectin chrome. You’ll see something like this: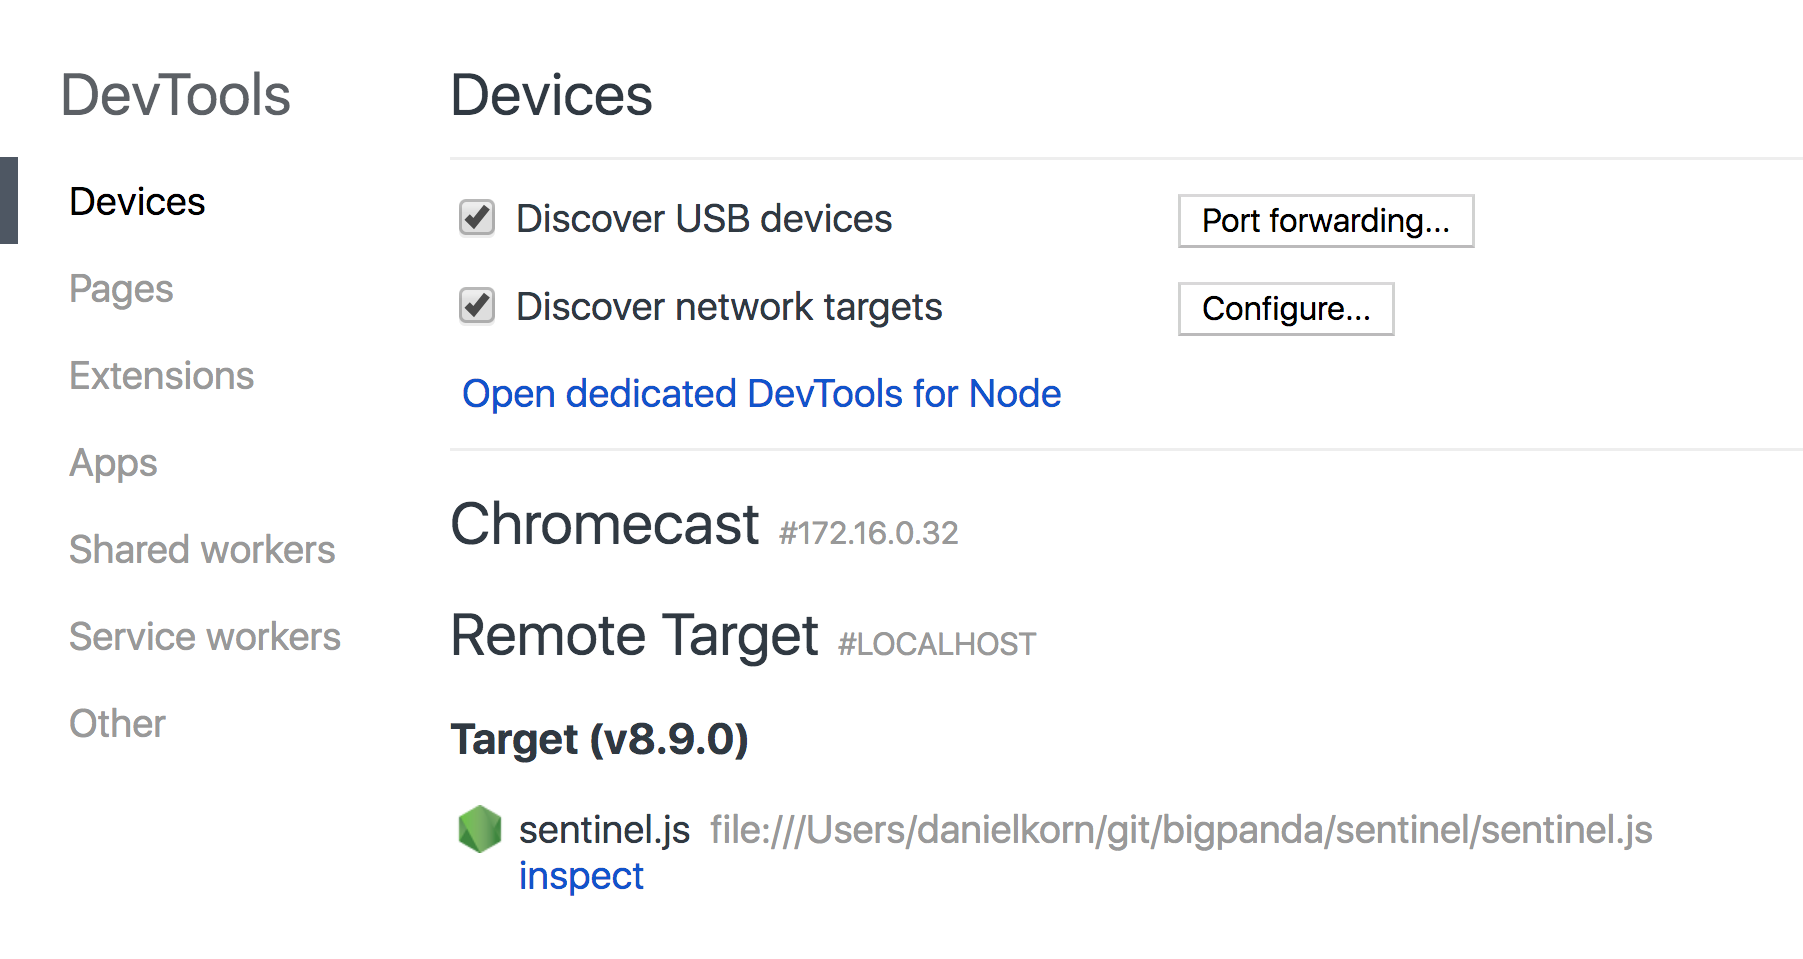
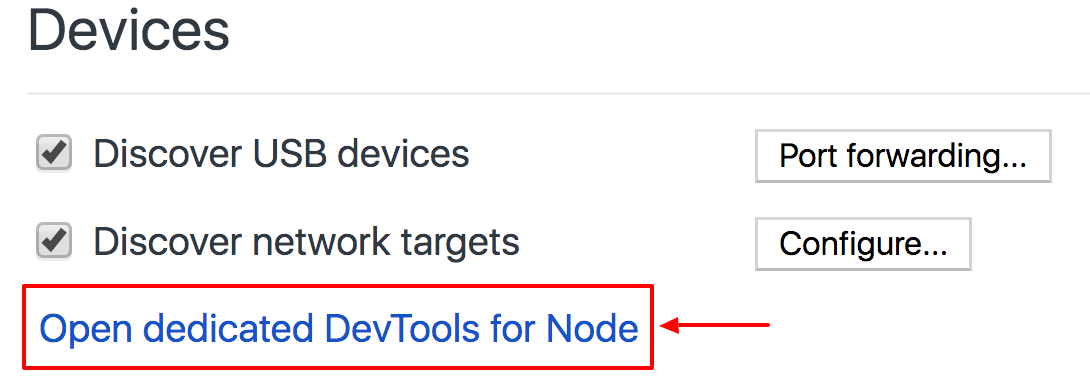
-
Click the Open dedicated DevTools for Node link
A pop window will open, that’s your debugger connected to Node right there. And it includes all the Chrome DevTools features we all love
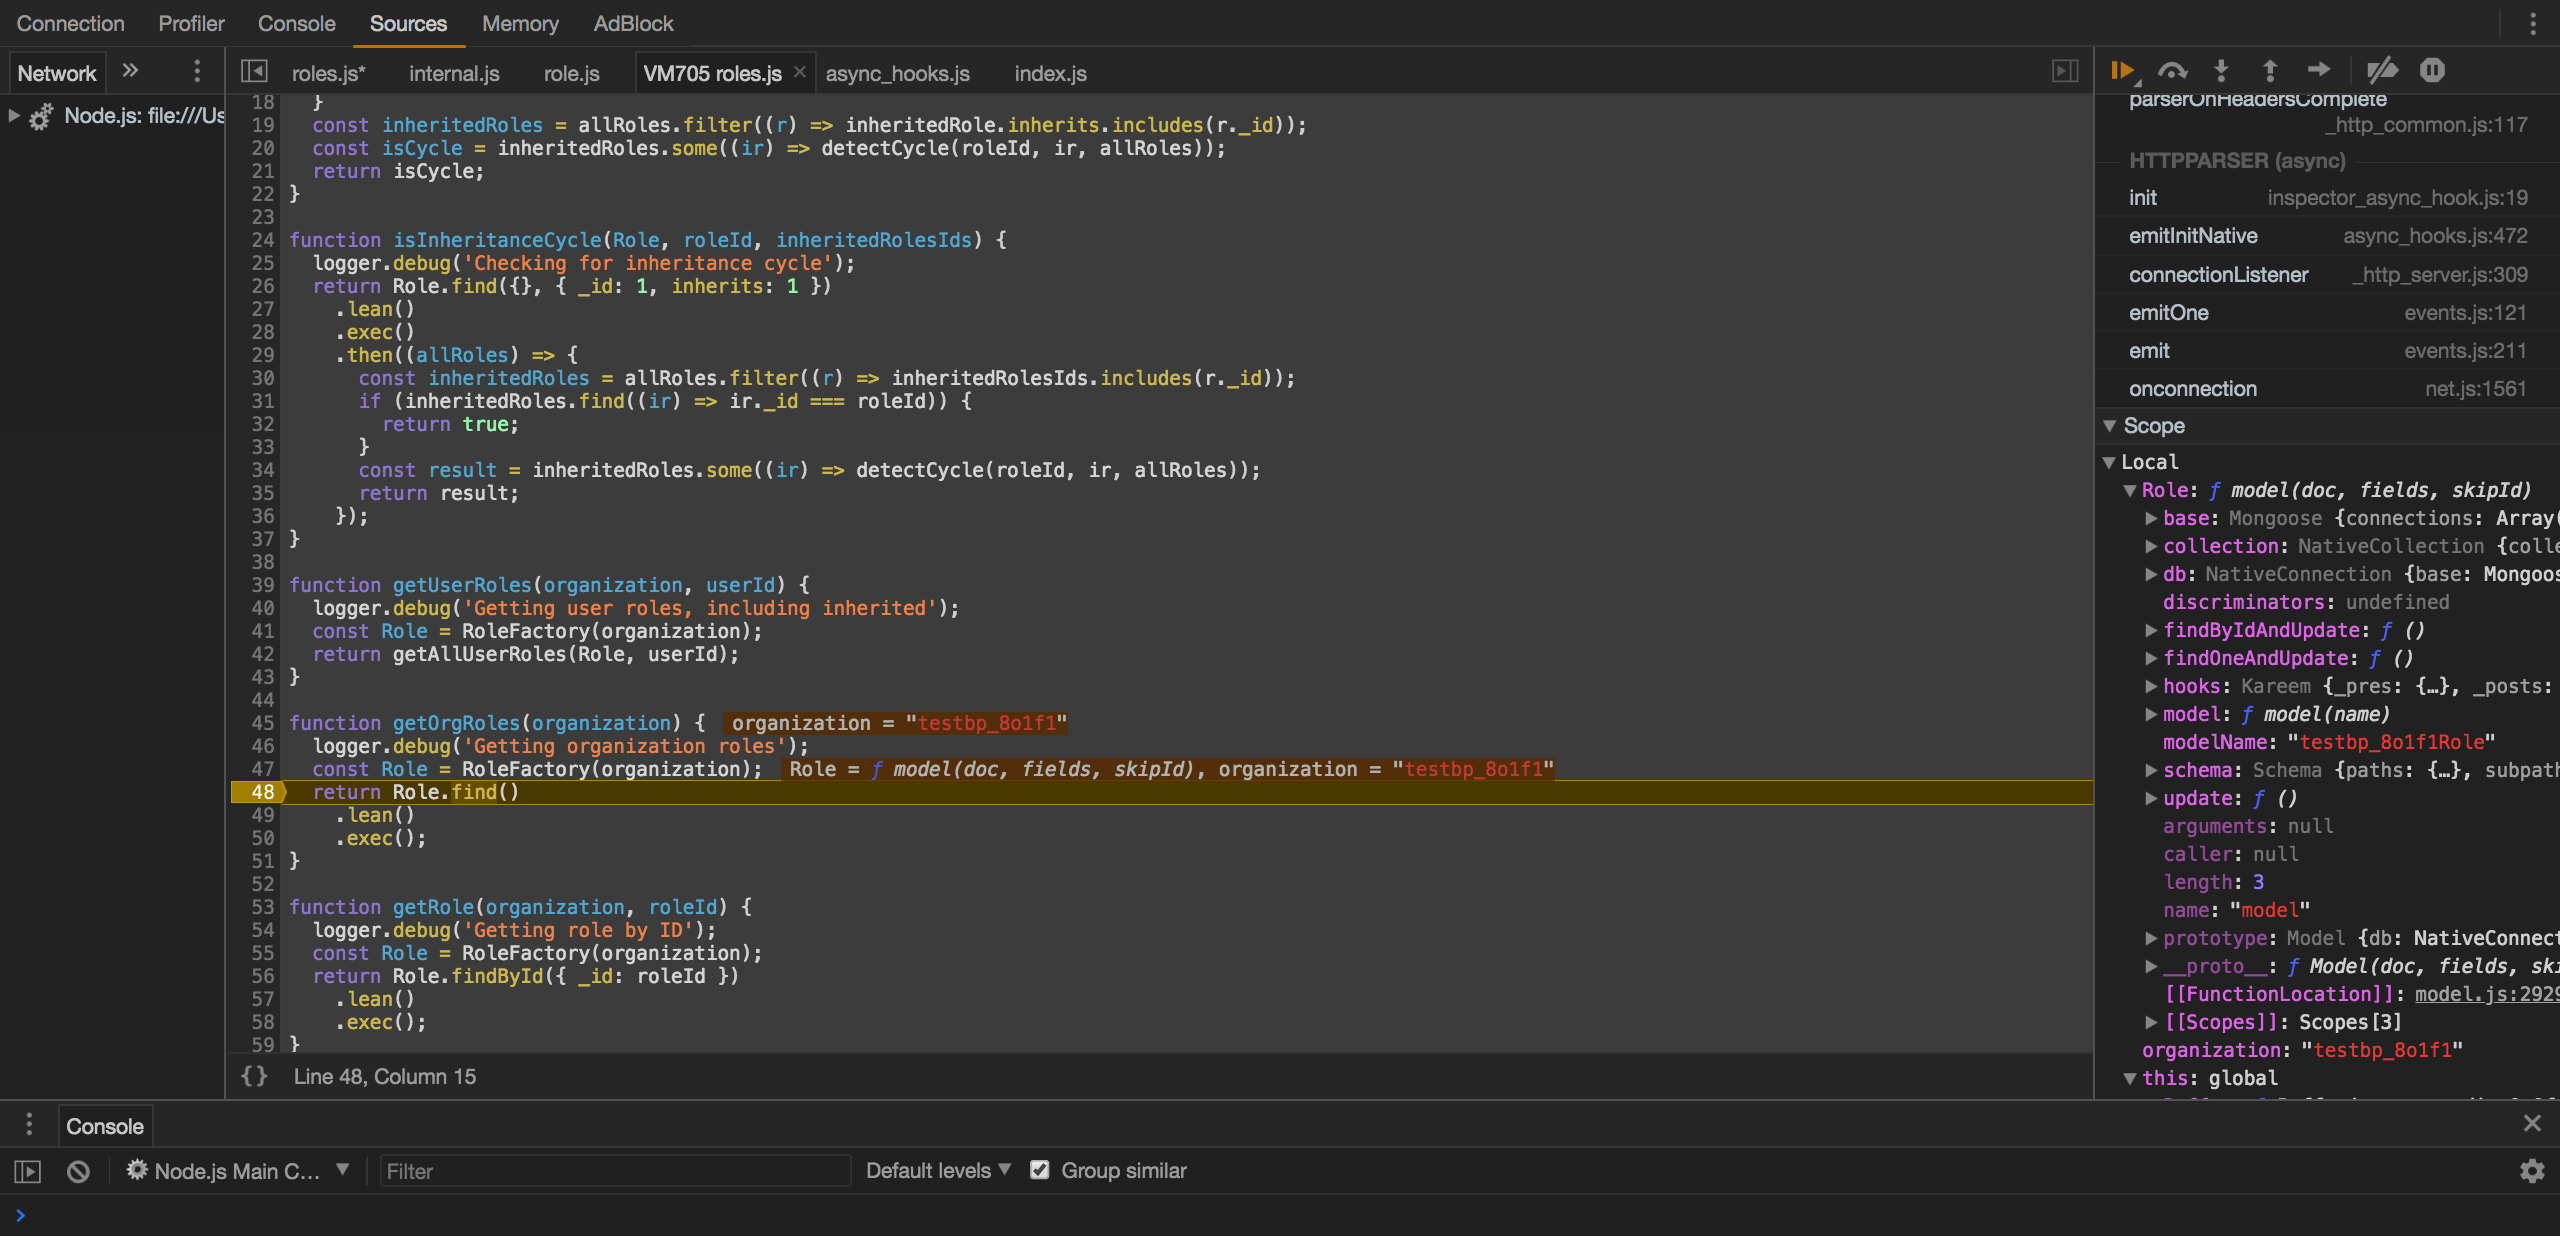
Go ahead and add breakpoints, use blackboxing, live edit your source code, evaluate vars and expressions in scope, use the console and take advantage of many more advanced options.
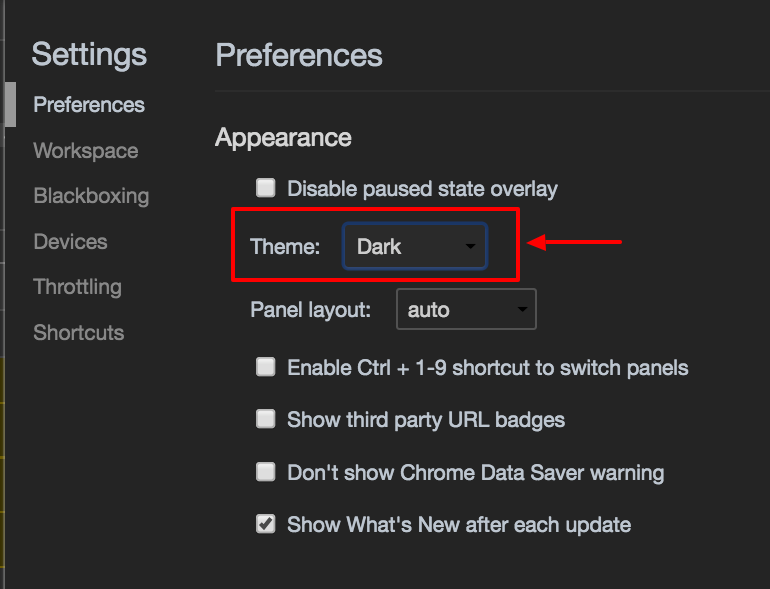
Pro Tip
Dark mode, all the cool kids are doing it.
Open DevTools -> Settings -> Prefernces, Appearance -> choose Dark